Multiple columns of Row Labels
Note: {tfrmt} version 0.3.0 brings support for multiple row label columns! See the Row Group Plan vignette for details
It is not all that unusual for listings (and some tables) to have
multiple row label columns. When this happens, it is often easier to
avoid using gt’s out-of-the box stub functions/formatting. An example of
a table like this is the “Summary of Number of Subjects by Site” from
the CDISC pilot. 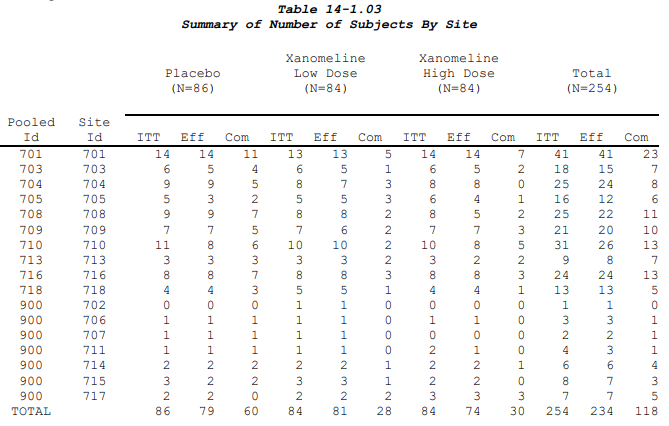
To make this table the values will be long with “Pooled Id” and “Site Id” in their own columns, as if they were group or label variables. We also will need a column for the parameters even though they are all the same.
data <- tibble::tribble(
  ~`Pooled Id` , ~`Site Id` ,
  "701"        , "701"      ,
  "703"        , "703"      ,
  "704"        , "704"      ,
  "705"        , "705"      ,
  "708"        , "708"      ,
  "709"        , "709"      ,
  "710"        , "710"      ,
  "713"        , "713"      ,
  "716"        , "716"      ,
  "718"        , "718"      ,
  "900"        , "702"      ,
  "900"        , "706"      ,
  "900"        , "707"      ,
  "900"        , "711"      ,
  "900"        , "714"      ,
  "900"        , "715"      ,
  "900"        , "717"      ,
  "Total"      , " "
) |>
  tidyr::crossing(
    col1 = c(
      "Placebo (N=86)",
      "Xanomeline Low Dose (N=84)",
      "Xanomeline High Dose (N=84)",
      "Total (N=254)"
    ),
    col2 = factor(c("ITT", "Eff", "Com"), levels = c("ITT", "Eff", "Com"))
  ) |>
  dplyr::mutate(
    val = rpois(216, 15), # Here I am just faking the data for display purposes
    param = "val"
  )
Once we have the data in the standard ARD format we can make the
tfrmt. What makes this tfrmt different is we
won’t include group or label, and our two ID columns will be displayed
as regular columns. This also means that all columns of the table,
including the ID columns, can be ordered via the
col_plan(). Because the col_plan() follows the
conventions of select() we can’t specify the order of the
highest level spanning columns and the lower level columns. But,
tfrmt respects the order things are put in, which is why we
used a factor for the populations.
tfrmt(
  param = "param",
  value = "val",
  column = vars(col1, col2),
  body_plan = body_plan(
    frmt_structure(group_val = ".default", label_val = ".default", frmt("XX"))
  ),
  row_grp_plan = row_grp_plan(label_loc = element_row_grp_loc("column")),
  col_plan = col_plan(
    `Pooled Id`,
    `Site Id`,
    contains("Placebo"),
    contains("High Dose"),
    contains("Low Dose"),
    everything()
  )
) |>
print_to_gt(data)| Pooled Id | Site Id |
Placebo (N=86)
|
Total (N=254)
|
Xanomeline High Dose (N=84)
|
Xanomeline Low Dose (N=84)
|
||||||||
|---|---|---|---|---|---|---|---|---|---|---|---|---|---|
| ITT | Eff | Com | ITT | Eff | Com | ITT | Eff | Com | ITT | Eff | Com | ||
| 701 | 701 | 9 | 11 | 14 | 17 | 19 | 7 | 11 | 13 | 12 | 11 | 8 | 16 |
| 703 | 703 | 12 | 14 | 17 | 11 | 14 | 16 | 17 | 24 | 13 | 13 | 15 | 17 |
| 704 | 704 | 17 | 13 | 12 | 15 | 21 | 15 | 14 | 7 | 7 | 19 | 15 | 12 |
| 705 | 705 | 20 | 11 | 25 | 15 | 17 | 15 | 7 | 18 | 11 | 15 | 15 | 17 |
| 708 | 708 | 6 | 15 | 17 | 16 | 15 | 20 | 12 | 10 | 16 | 20 | 15 | 12 |
| 709 | 709 | 9 | 11 | 15 | 20 | 17 | 17 | 14 | 15 | 14 | 22 | 20 | 17 |
| 710 | 710 | 17 | 12 | 12 | 14 | 16 | 13 | 16 | 19 | 19 | 14 | 16 | 21 |
| 713 | 713 | 13 | 18 | 20 | 13 | 13 | 11 | 19 | 11 | 12 | 19 | 23 | 17 |
| 716 | 716 | 17 | 10 | 16 | 13 | 17 | 23 | 16 | 8 | 14 | 15 | 23 | 15 |
| 718 | 718 | 15 | 17 | 13 | 12 | 11 | 18 | 15 | 9 | 16 | 21 | 22 | 16 |
| 900 | 702 | 9 | 14 | 11 | 11 | 18 | 20 | 10 | 14 | 10 | 16 | 15 | 10 |
| 900 | 706 | 23 | 15 | 13 | 18 | 18 | 7 | 22 | 11 | 23 | 13 | 17 | 20 |
| 900 | 707 | 15 | 15 | 15 | 15 | 13 | 17 | 10 | 13 | 23 | 10 | 21 | 11 |
| 900 | 711 | 17 | 22 | 14 | 24 | 19 | 19 | 19 | 13 | 11 | 19 | 23 | 19 |
| 900 | 714 | 19 | 17 | 13 | 20 | 14 | 13 | 19 | 13 | 14 | 9 | 10 | 14 |
| 900 | 715 | 14 | 21 | 15 | 12 | 16 | 9 | 17 | 15 | 10 | 15 | 11 | 15 |
| 900 | 717 | 12 | 17 | 9 | 12 | 17 | 8 | 12 | 11 | 12 | 24 | 16 | 19 |
| Total | 13 | 12 | 13 | 10 | 10 | 11 | 14 | 10 | 20 | 15 | 9 | 12 | |