While ggplot2 is excellent for creating individual visualisations, we often need to combine multiple independent plots into a single composite graphic. The {patchwork} package is designed to make this process incredibly simple by treating ggplot objects as mathematical elements that can be added together.
The power of {patchwork} lies in its operator-based syntax:
| or + : Places plots side-by-side.
/ : Stacks plots vertically.
() : Groups plots together to create complex, nested layouts.
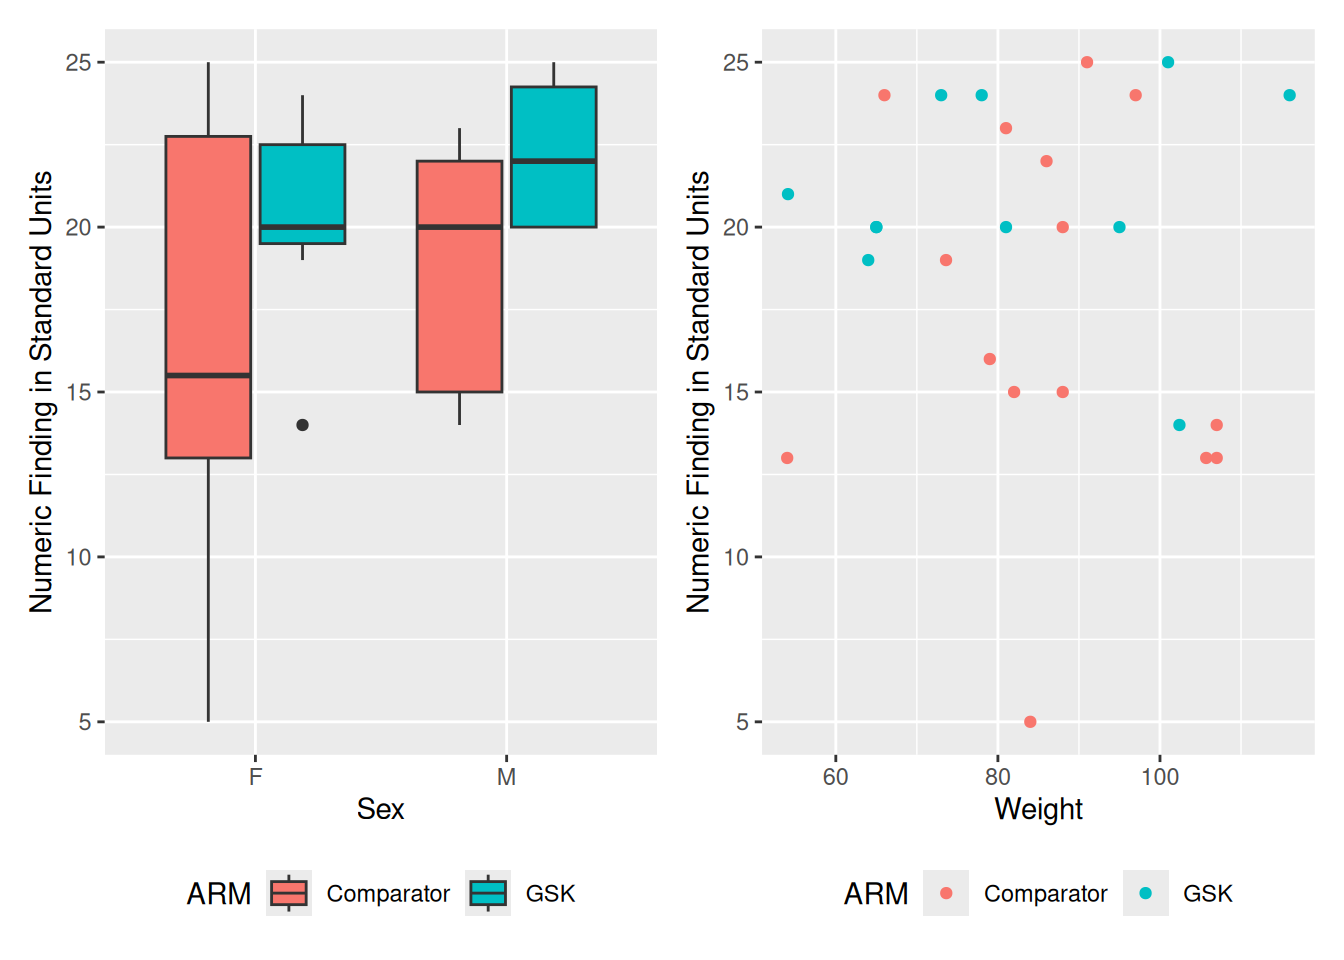
# Create two plotsact_bl <- act_full |>filter(VISITNUM ==40)base_info <-ggplot(data = act_bl, aes(y = ACTTOT)) +theme(legend.position ="bottom")plot1 <- base_info +geom_boxplot(aes(x = SEX, fill = ARM)) +labs(fill ="ARM") # Modify legend labelplot2 <- base_info +geom_point(aes(x = WEIGHT, colour = ARM)) +labs(colour ="ARM") # Modify legend label# Arrange side by side using patchwork syntaxlibrary(patchwork)# The '|' operator places plots side-by-sideplot1 | plot2
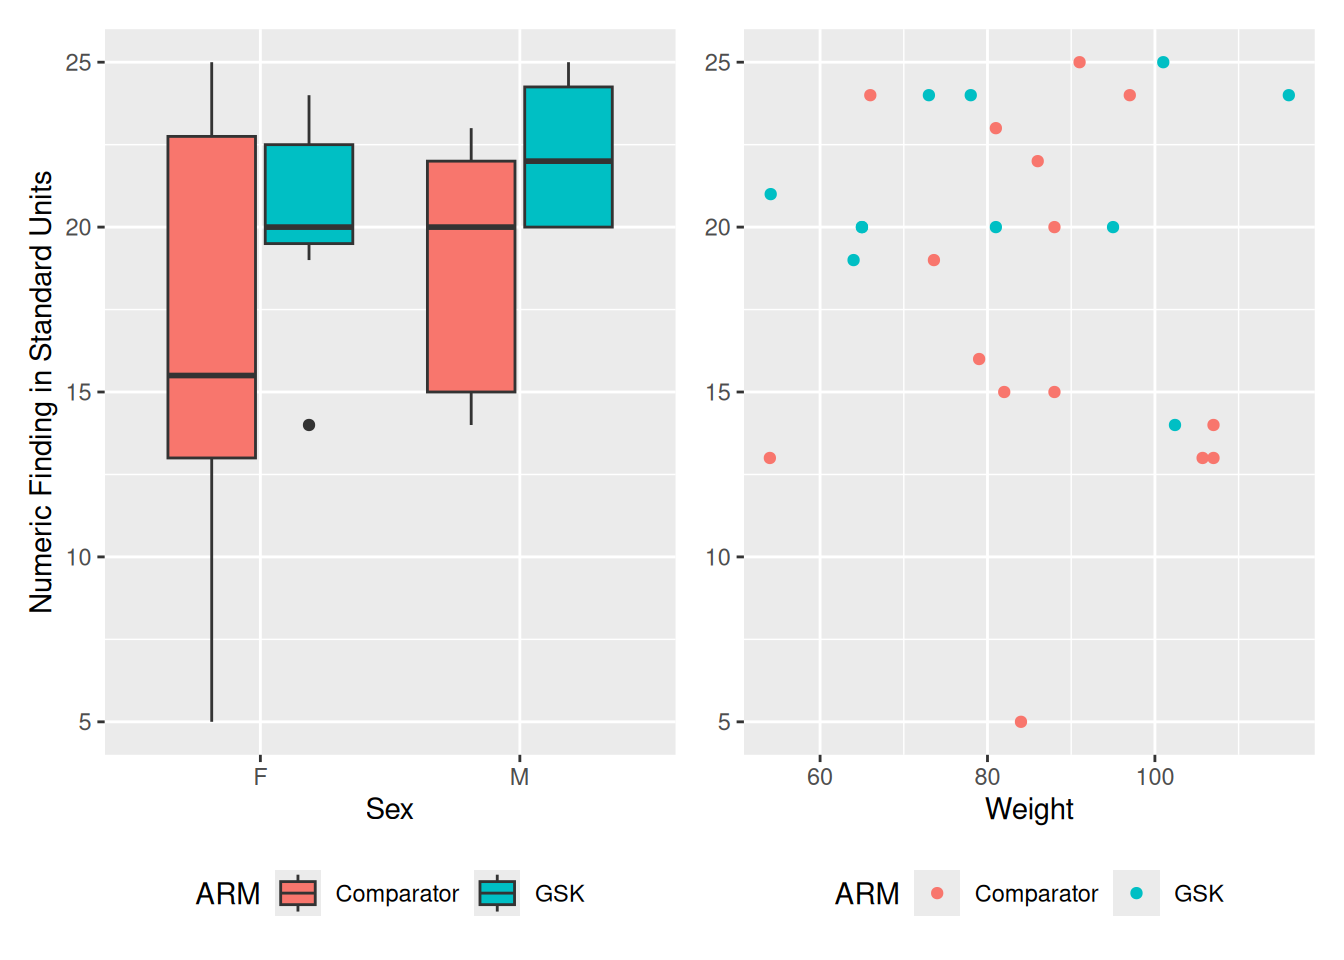
# collect the axis titles(plot1 | plot2) +plot_layout(axis_titles ="collect")
10.2 The {docorator} package
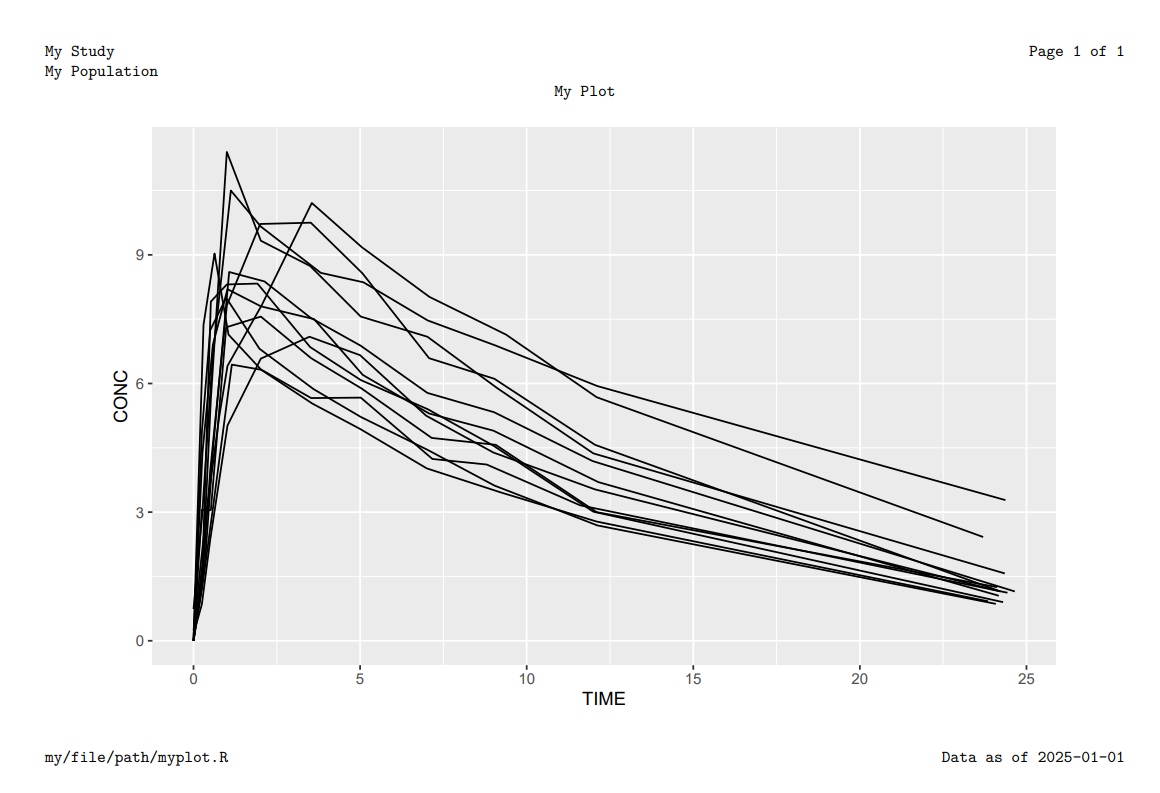
The {docorator} package helps create production displays from R. Specifically, {docorator} saves TFLs to output files by providing the following functionality:
Decorate: Surround displays with document-level headers, footers, and page numbers
# Load packagelibrary(docorator) # Create figuremyplot <-ggplot(data = theoph, aes(x = TIME, y = CONC, group = SUBJID)) +geom_line()# Export display myplot |>as_docorator( display_name ="myplot",display_loc ="my/file/path",header =fancyhead(fancyrow(left ="My Study", center =NA, right =doc_pagenum()),fancyrow(left ="My Population", center =NA, right =NA),fancyrow(left =NA, center ="My Plot", right =NA) ),footer =fancyfoot(fancyrow(left =doc_path(display_name, display_loc), center =NA, right ="Data as of 2025-01-01") ) ) |>render_pdf()
10.3 Additional Packages
There are many, many more ggplot2 extensions available on CRAN (most beginning “gg*”). For example, we can add marginal histograms to scatter plots with ggExtra or cowplot. There are other packages that add new geoms such as wordclouds.
If you notice an issue, have suggestions for improvements, or want to view the source code, you can find it on GitHub.