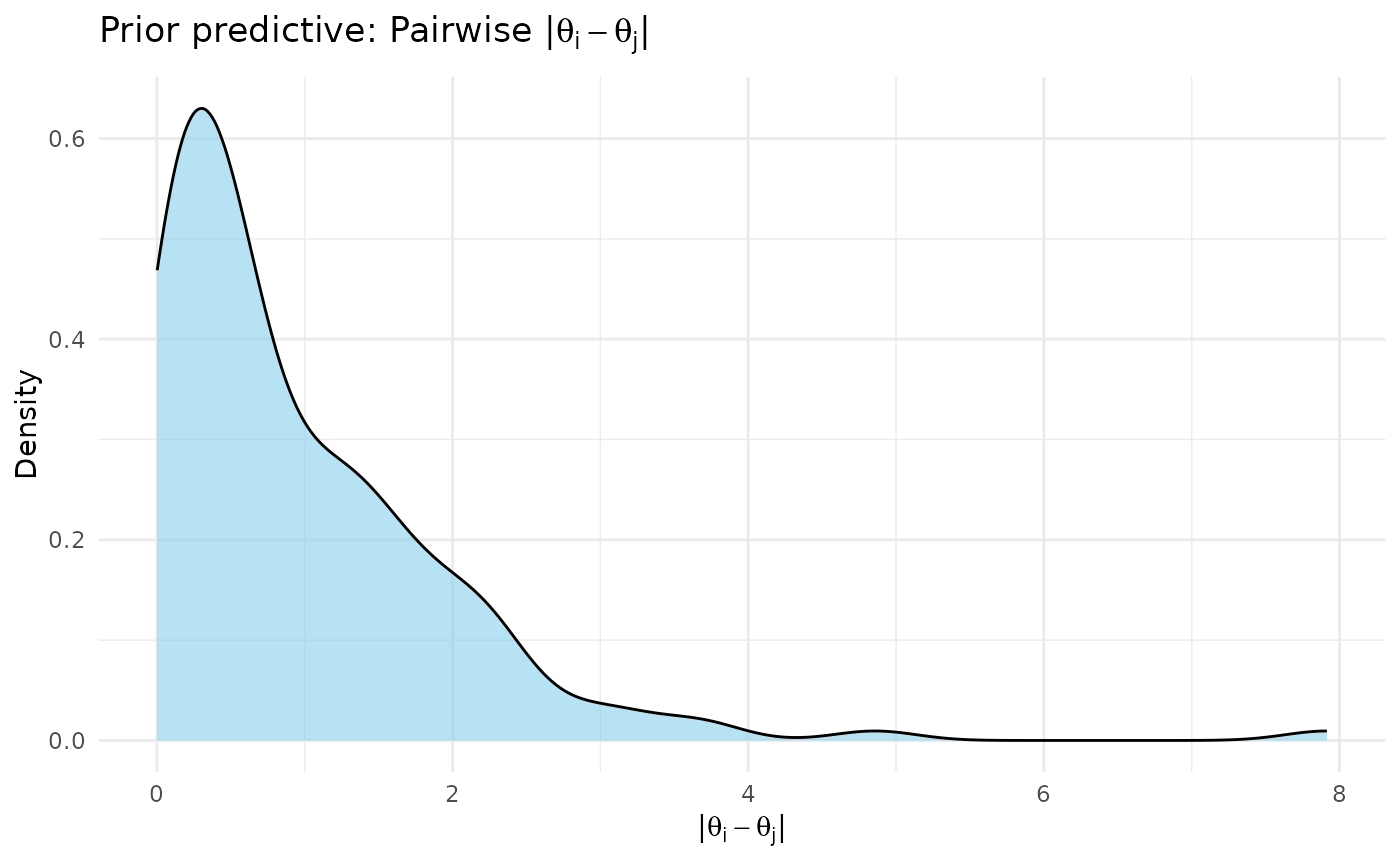
Plot prior predictive pairwise differences
Source:R/prior_predictive.R
plot.shrinkr_prior_contrasts.RdCreates a density plot of \(|\theta_i - \theta_j|\)
from prior predictive samples. Useful for calibrating hierarchical priors.
Styling matches plot.shrinkr_prior_pred() for visual consistency.
Usage
# S3 method for class 'shrinkr_prior_contrasts'
plot(x, by_pair = FALSE, ...)
Arguments
- x
A
shrinkr_prior_contrastsobject fromprior_pairwise_differences.- by_pair
Logical; if
TRUE, facet by pair. IfFALSE(default), pool all pairwise differences into a single plot.- ...
Additional arguments (currently unused).
Examples
priors <- list(
  mu = distributional::dist_normal(0, 5),
  tau = distributional::dist_truncated(distributional::dist_normal(0, 1), lower = 0)
)
prior_pred <- sample_prior_predictive(priors, n_groups = 3, n_draws = 50)
pw <- prior_pairwise_differences(prior_pred)
plot(pw)