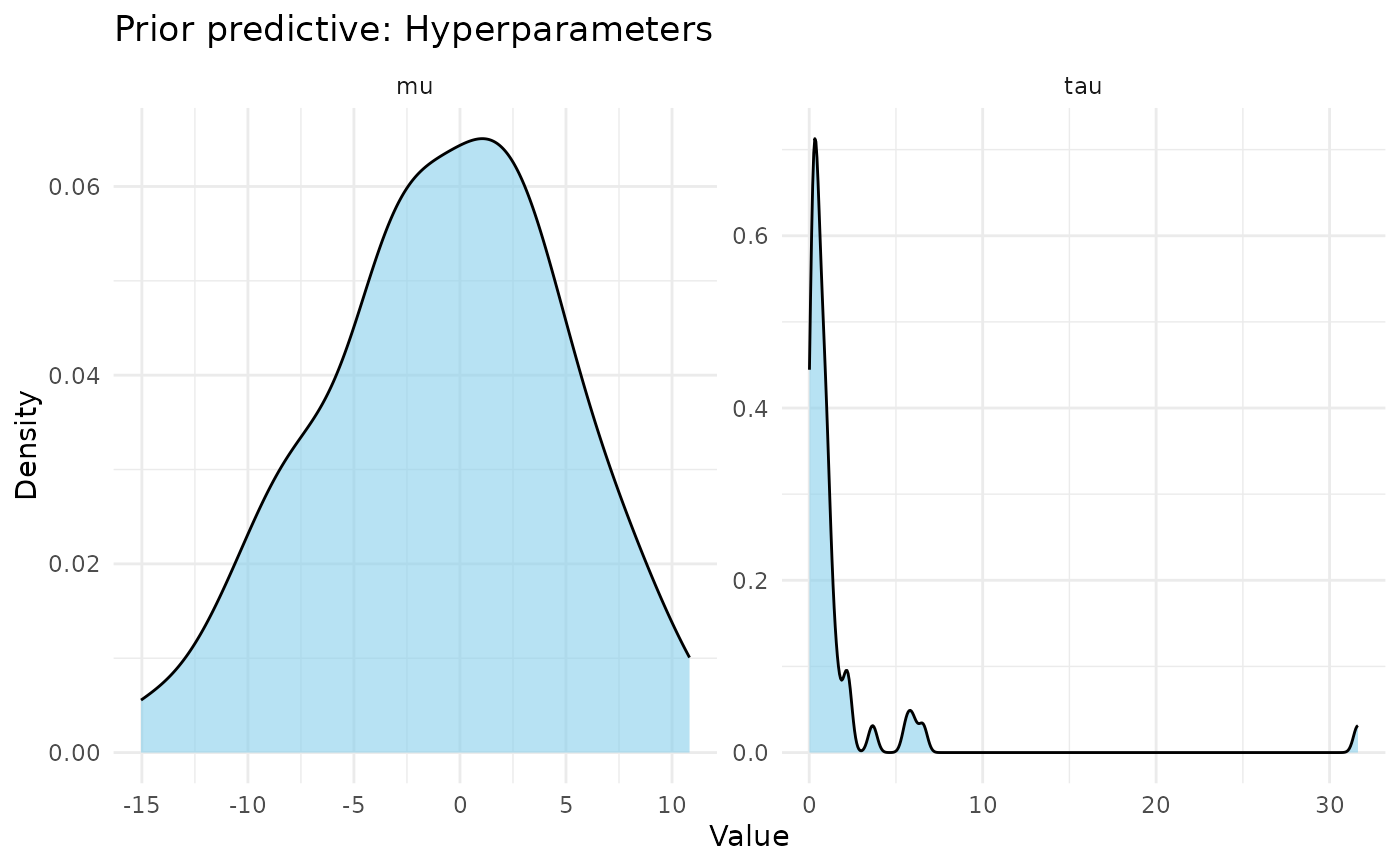
Visualizes the prior predictive distribution for hyperparameters (mu and tau) and subgroup effects (theta). Requires the ggplot2 package.
Arguments
- x
A
shrinkr_prior_predobject fromsample_prior_predictive.- type
Character; type of plot. Options:
"both"- Both hyperparameter and theta plots (default)"hyperparameters"- Density plots for mu and tau only"theta"- Violin plots for theta by group only
- ...
Additional arguments (currently unused).
Value
A ggplot2 object, or a list of two ggplot2 objects if type = "both"
and patchwork package is not available. If patchwork is available and
type = "both", returns a combined plot.
See also
sample_prior_predictive for generating samples,
as.data.frame.shrinkr_prior_pred for extracting data
Examples
priors <- list(
  mu = distributional::dist_normal(0, 5),
  tau = distributional::dist_truncated(distributional::dist_student_t(3, 0, 1), lower = 0)
)
prior_pred <- sample_prior_predictive(priors, n_groups = 3, n_draws = 50)
plot(prior_pred, type = "hyperparameters")