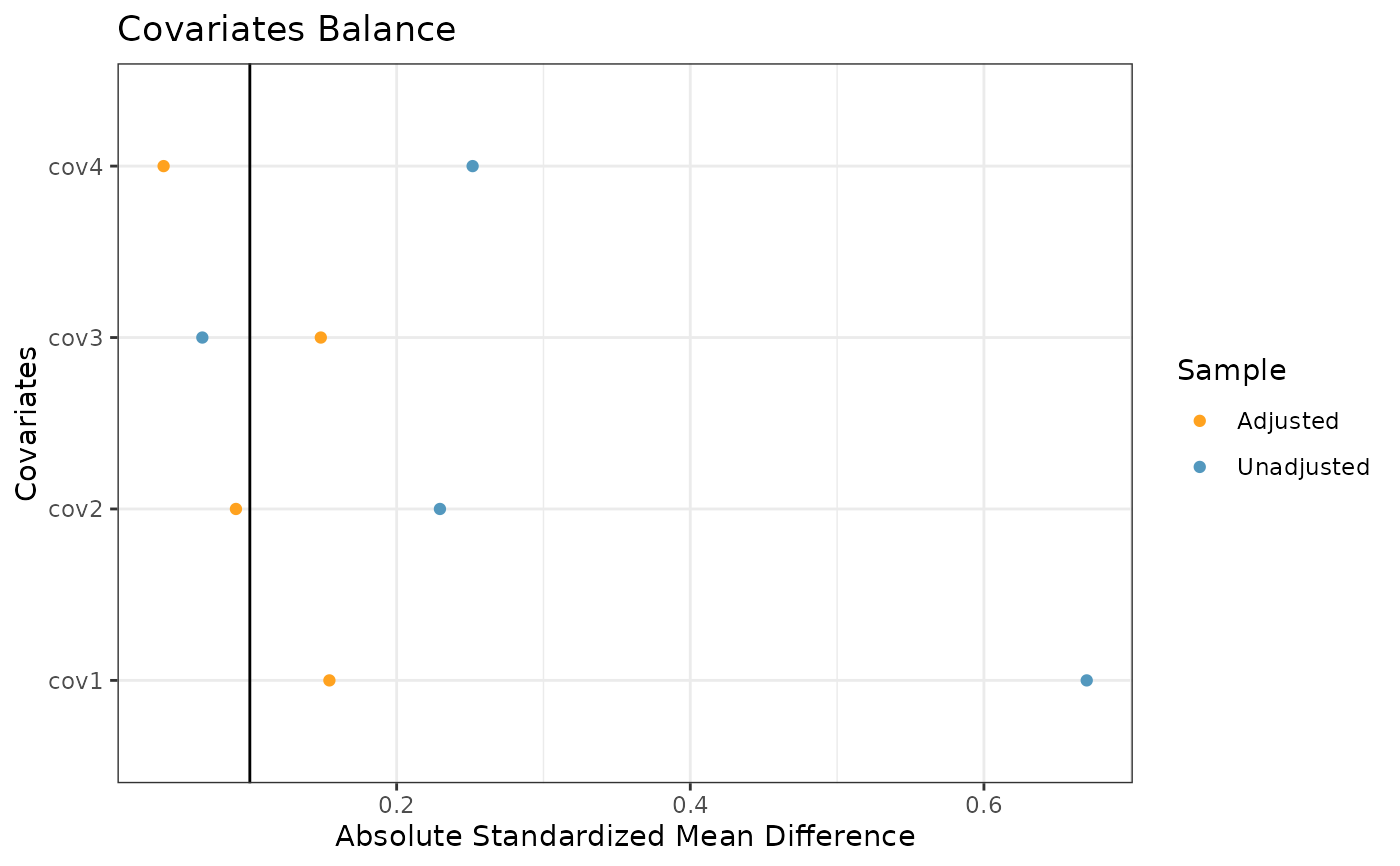
Plot the unadjusted and IPW-adjusted absolute standardized mean differences for each covariate.
Examples
library(dplyr)
ps_obj <- calc_prop_scr(internal_df = filter(int_norm_df, trt == 0),
                       external_df = ex_norm_df,
                       id_col = subjid,
                       model = ~ cov1 + cov2 + cov3 + cov4)
# Plotting the Propensity Scores
prop_scr_love(ps_obj, reference_line = 0.1)