Propensity Score Cloud Plot
Examples
library(dplyr)
ps_obj <- calc_prop_scr(internal_df = filter(int_norm_df, trt == 0),
external_df = ex_norm_df,
id_col = subjid,
model = ~ cov1 + cov2 + cov3 + cov4)
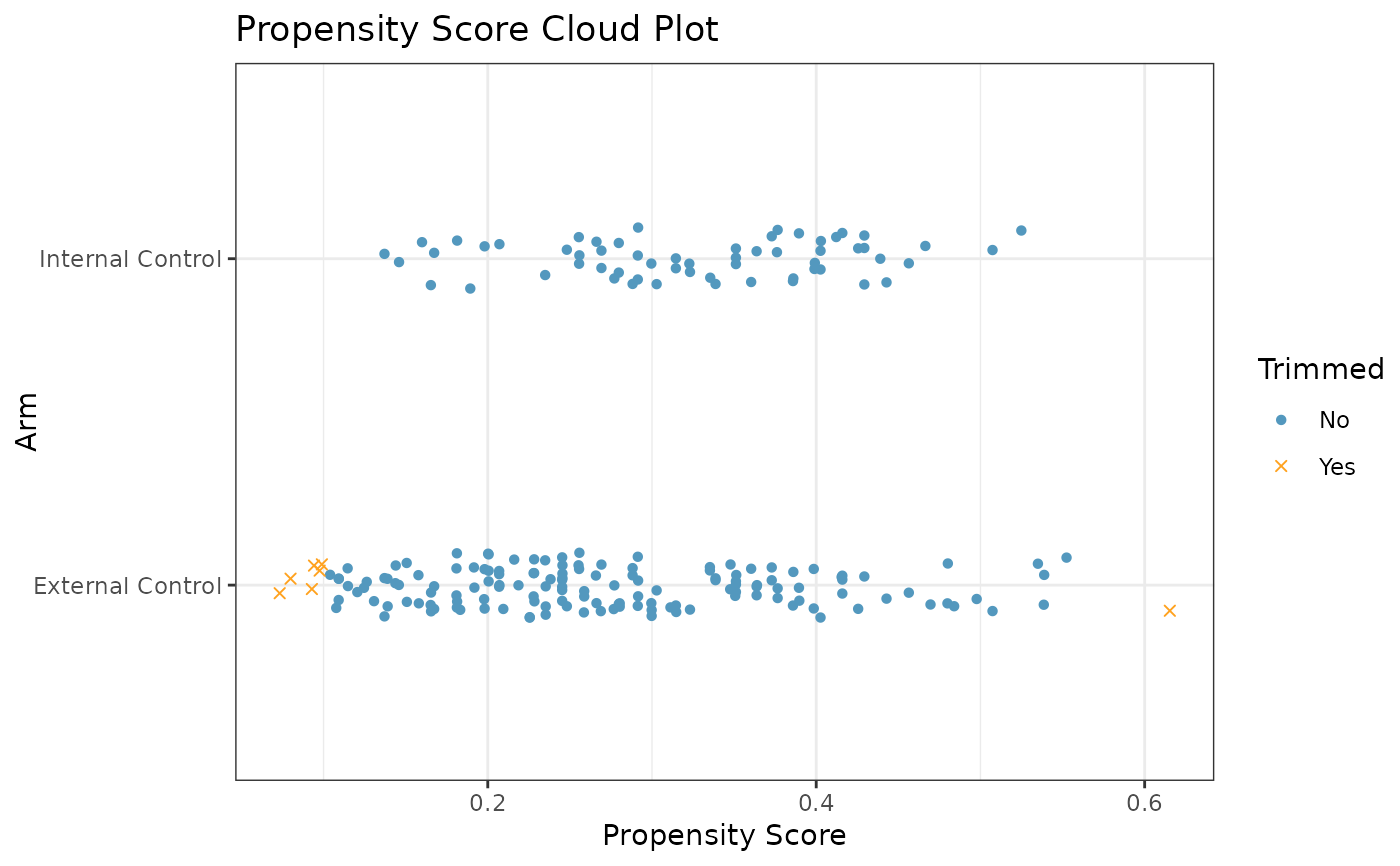
ps_obj_trimmed <- trim_ps(ps_obj, low = 0.1, high = 0.6)
# Plotting the Propensity Scores
prop_scr_cloud(ps_obj, trimmed_prop_scr = ps_obj_trimmed)