Plot Distribution
Examples
library(distributional)
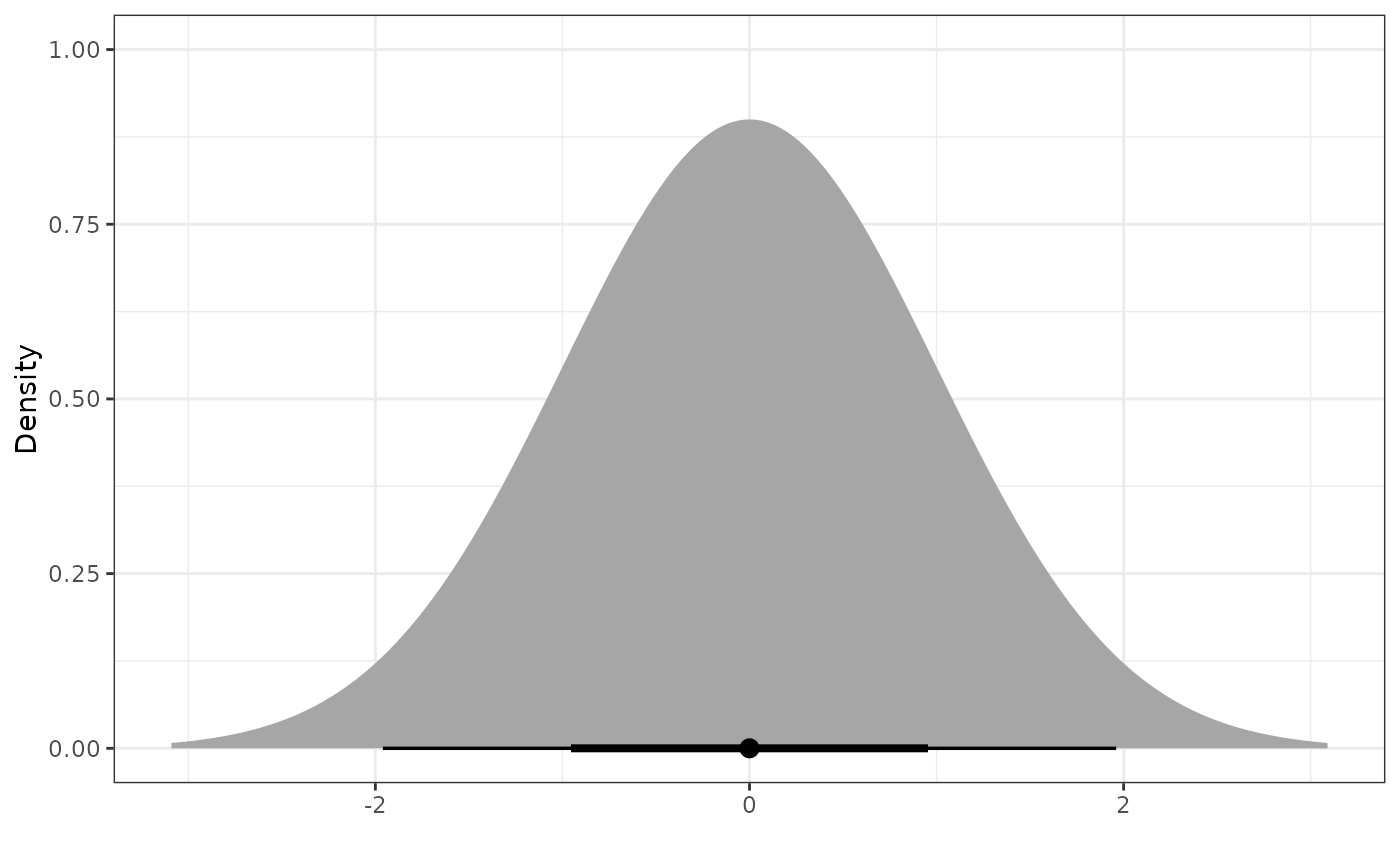
plot_dist(dist_normal(0, 1))
 plot_dist(dist_multivariate_normal(mu = list(c(1, 2)), sigma = list(matrix(c(4, 2, 2, 3), ncol=2))))
 #Plotting Multiple
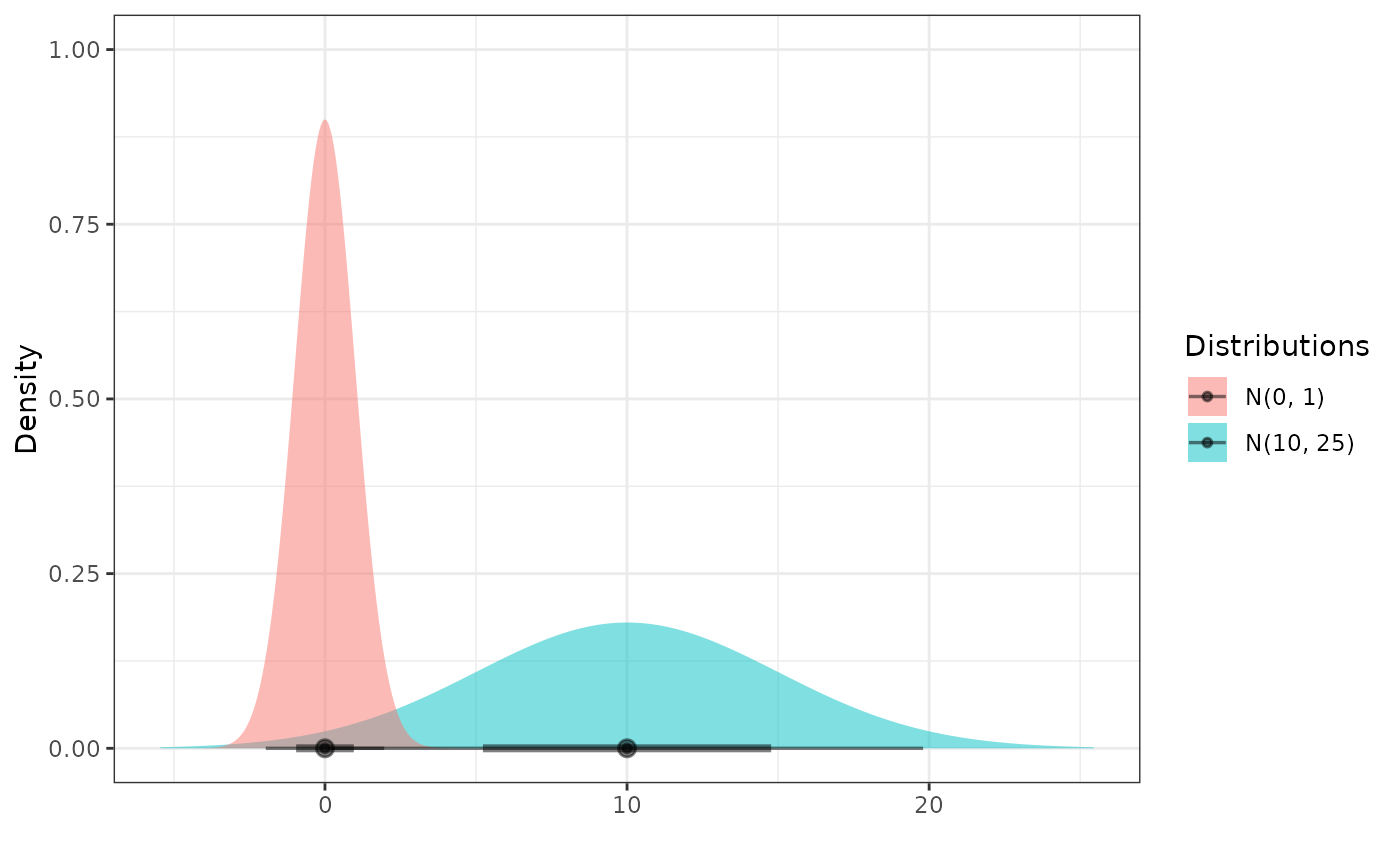
plot_dist(dist_normal(0, 1), dist_normal(10, 5))
#Plotting Multiple
plot_dist(dist_normal(0, 1), dist_normal(10, 5))
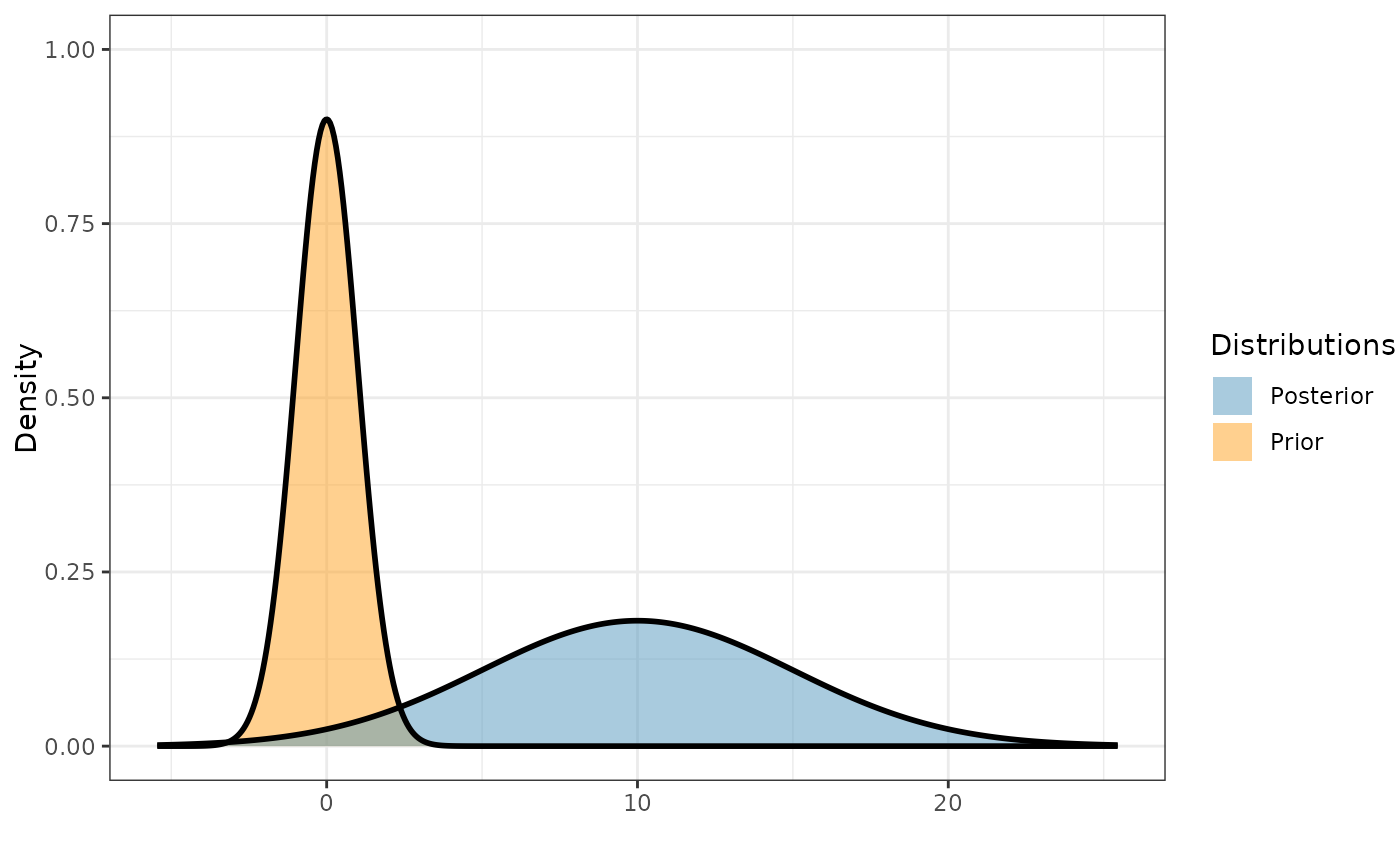
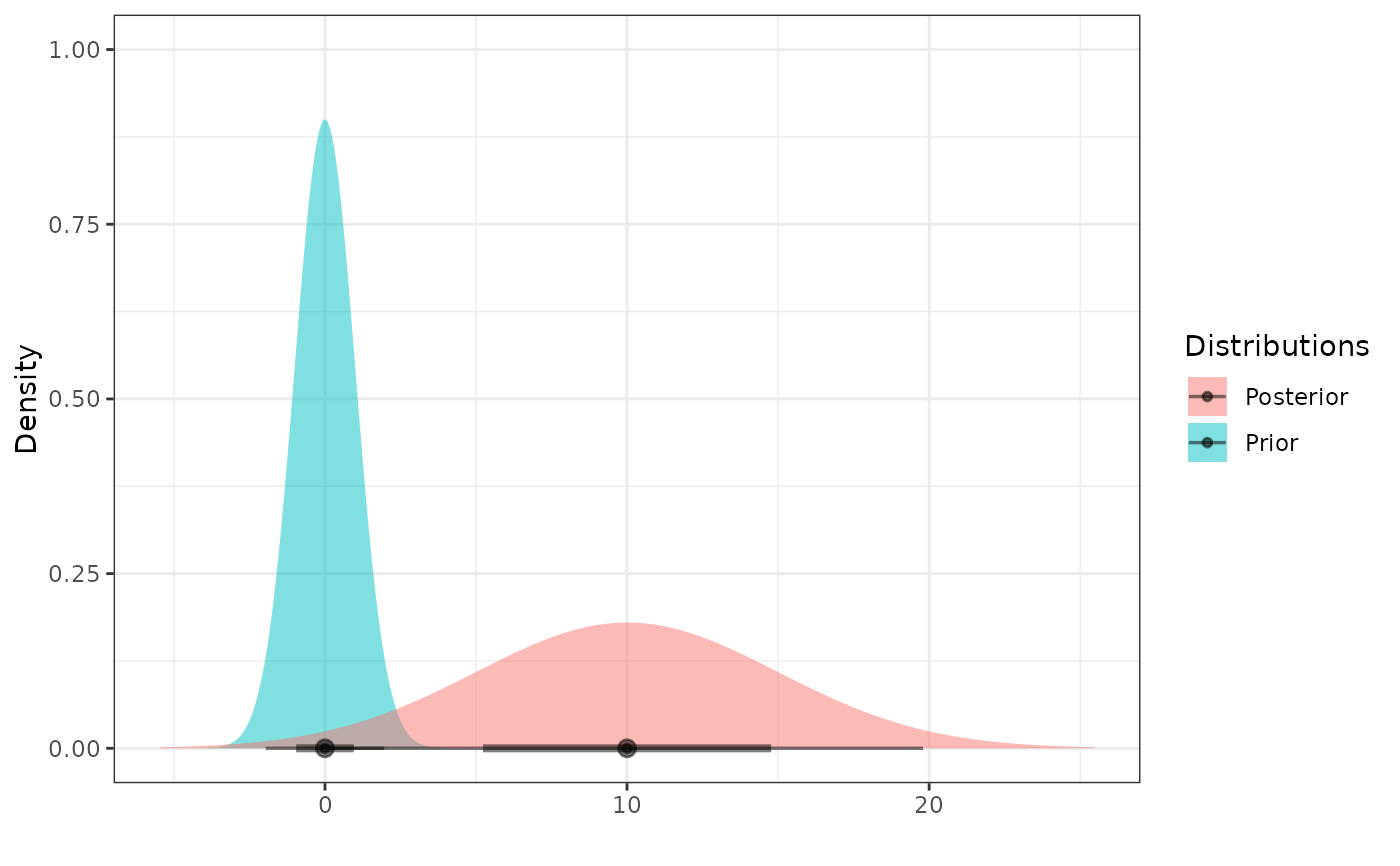 plot_dist('Prior' = dist_normal(0, 1), 'Posterior' = dist_normal(10, 5))