Autoplot method for multigrain_graph_constraint objects
Source: R/plot_graph_constraint.R
autoplot.multigrain_graph_constraint.RdAutoplot method for multigrain_graph_constraint objects
Usage
# S3 method for class 'multigrain_graph_constraint'
autoplot(object, ..., root = NULL, digits = NULL, title = NULL)

# S3 method for class 'multigrain_graph_constraint'
plot(x, ..., root = NULL, digits = NULL, title = NULL)
Arguments
- object
A
multigrain_graph_constraintobject.- ...
Additional arguments.
- root
A numeric vector indicating which nodes to be regarded as root in the tree layout. Passed down to
igraph::layout_as_tree().- digits
Number of decimal places to round to (between 0 and 3). Defaults to
NULLwhich will choose the number of digits based on how crowded the graph plot will be:a single digit if more than 8 hypotheses
2 digits if 5 to 8 hypotheses
3 digits if 4 or fewer hypotheses
- title
An optional plot title.
- x
A
multigrain_graph_constraintobject.
Value
A ggraph::ggraph() object.
Details
Both plot() and autoplot() methods require an optional dependency,
ggplot2.
Examples
library(ggplot2)
gc1 <- graph_constraint(
c(NA, NA, 0, 0, 0),
matrix(
c(
0, 0.8, 0.2, 0, 0,
NA, 0, 0, NA, 0,
NA, 0.8, 0, 0.1, NA,
0.9, NA, NA, 0, NA,
0, 0, 0, 1, 0
),
nrow = 5,
byrow = TRUE
)
)
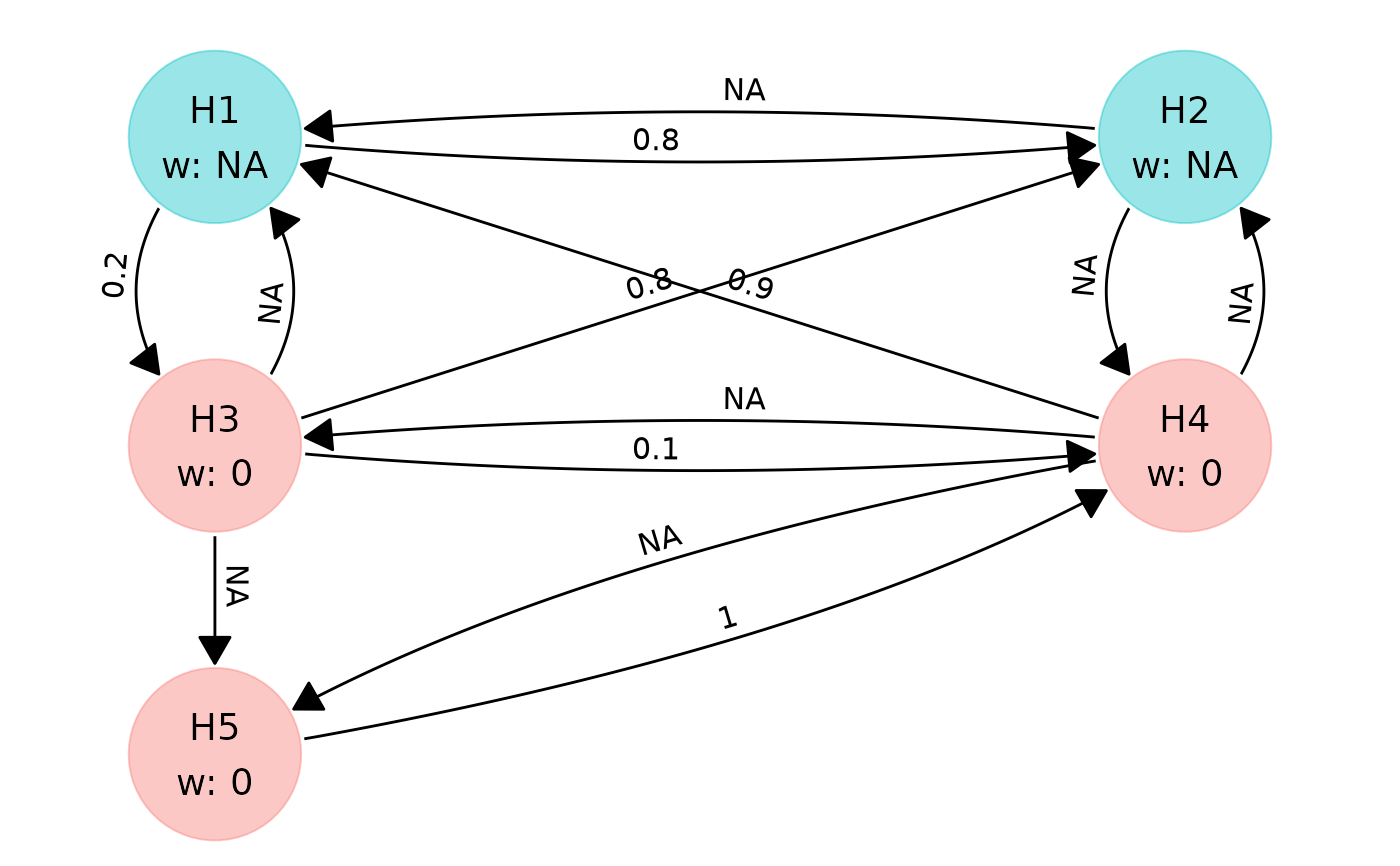
autoplot(gc1)
 # If you want to control which nodes are treated as root, you can pass them
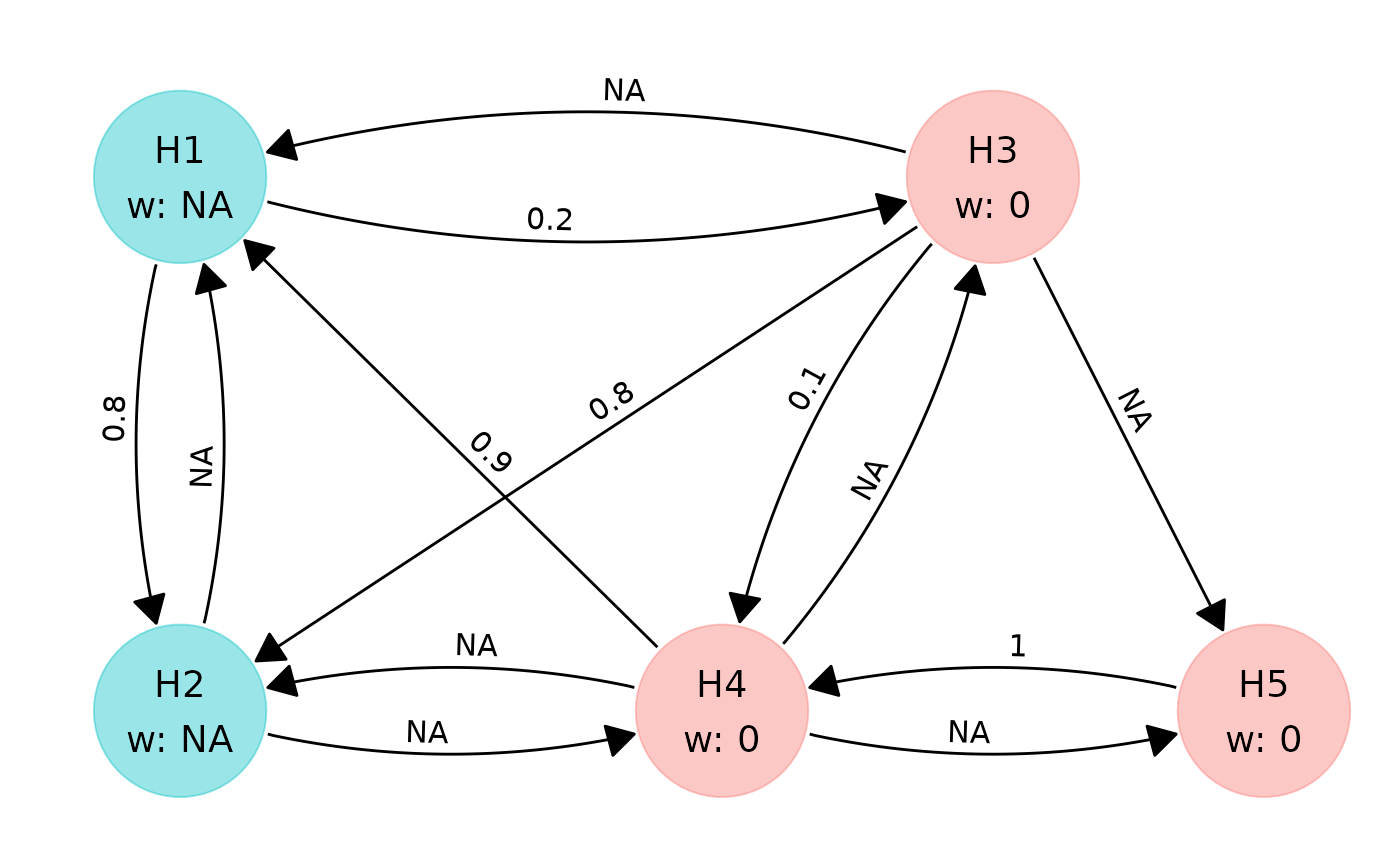
# as a numeric vector via the `root` argument. For example, we want nodes 1
# and 3 to be plotted as root:
autoplot(gc1, root = c(1, 3))
# If you want to control which nodes are treated as root, you can pass them
# as a numeric vector via the `root` argument. For example, we want nodes 1
# and 3 to be plotted as root:
autoplot(gc1, root = c(1, 3))
 # You can control the number of decimal places to round to
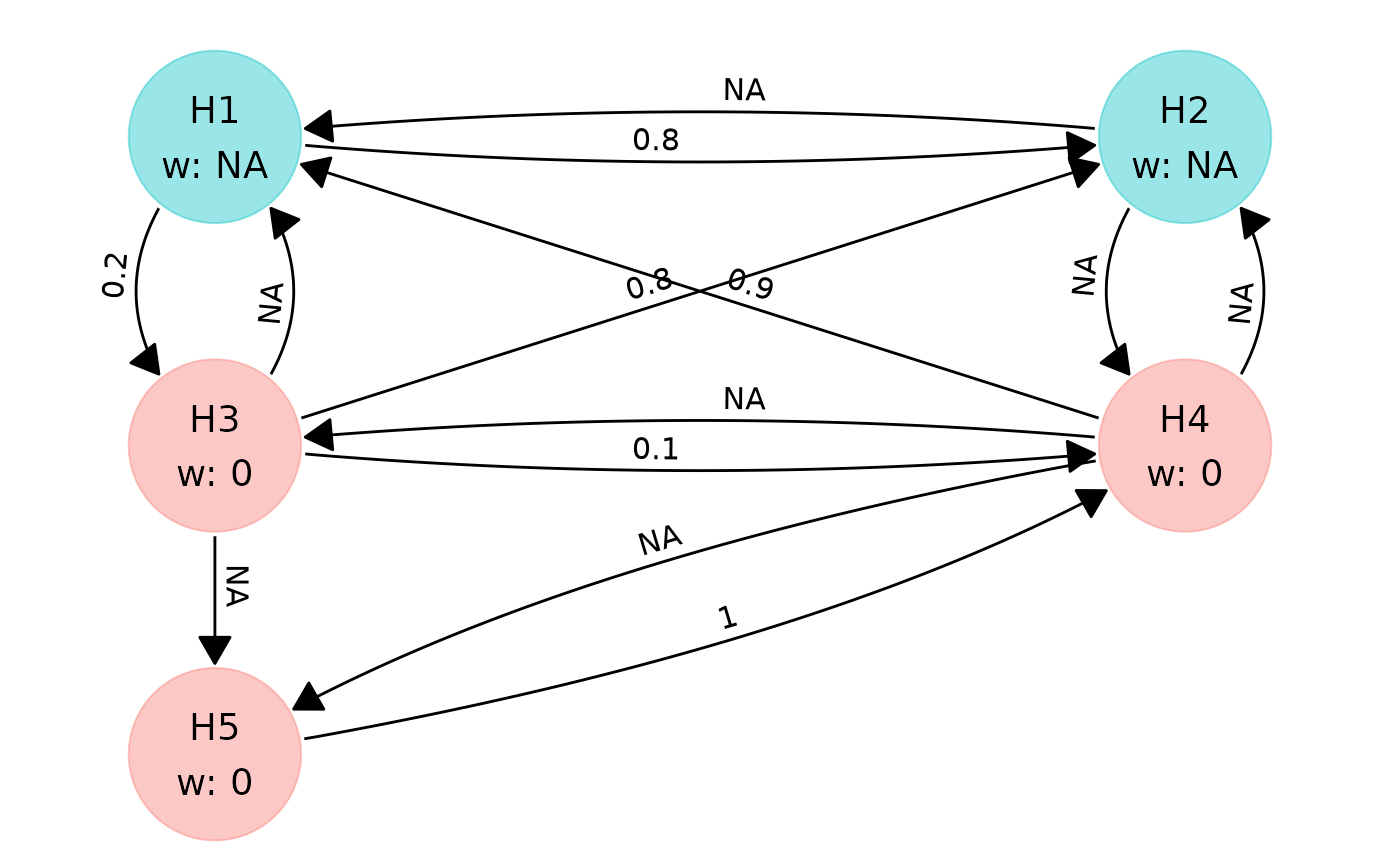
autoplot(gc1, digits = 1)
# You can control the number of decimal places to round to
autoplot(gc1, digits = 1)
 # You can supply a title
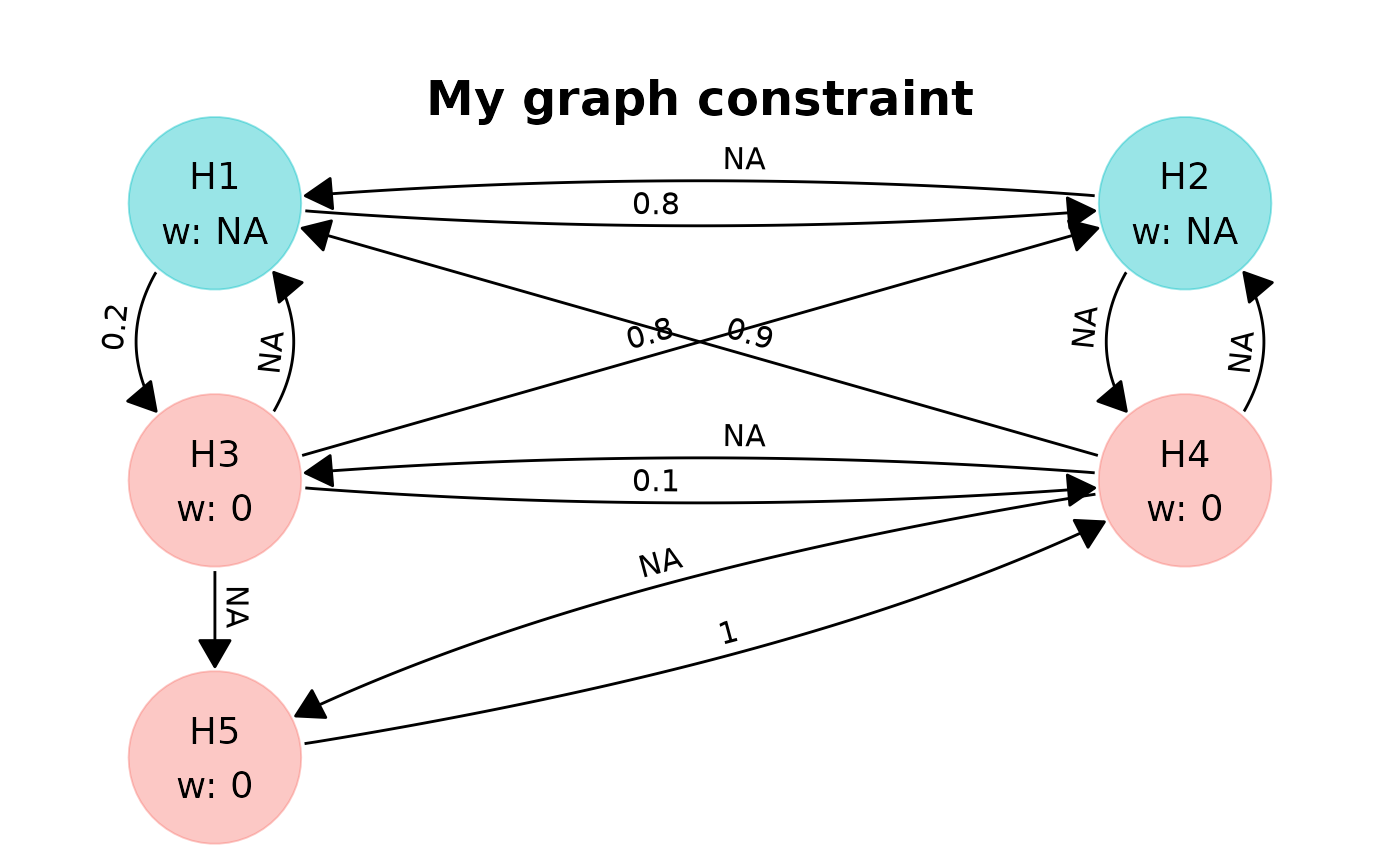
autoplot(gc1, title = "My graph constraint")
# You can supply a title
autoplot(gc1, title = "My graph constraint")